
Packages (Simulation)
Quality Guarantee

Certificate
Mouse Model for Chronic Stress Depression (CSD)
- Product No.DSI704Mu01
- Organism SpeciesMus musculus (Mouse) Same name, Different species.
- Prototype SpeciesHuman
- SourceInduced by medicine
- Model Animal StrainsBalb/c Mice(SPF), healthy, male, age: 4~6weeks, body weight:18g~20g.
- Modeling GroupingRandomly divided into six group: Control group, Model group, Positive drug group and Test drug group.
- Modeling Period4-6 weeks
- Modeling Method(1)"Male mice weight 20 ~ 22g. In dose of 2mg/kg body weight for intravenous injection of reserpine, while injection of the tested drug or saline,after 1h, observe in 15S within the animal ptosis of the situation. Before the experiment, the rectal temperature was measured three times, and the mean value was taken as the basal body temperature, then injection of reserpine in dose of 2 mg/kg body weight, the tested drug or saline was administered at the same time. At 6 hours after administration, the difference between the rectal temperature at each time point was compared between the administration group and the saline control group.When the animal body temperature was measured, the ambient temperature should be kept constant, preferably about 20 degrees. In dose of 2.5mg/Kg body weight of intravenous injection of reserpine, while the drug to be tested or saline, after 1h the animals are placed in the diameter of 7.5 cm round white paper for 15 s observation, compared with the control group and control group still The number of animals in the circle."(2)Male and female mice, weight 20 ~ 24 g. Before the experiment with an electronic thermometer measured by the anus temperature 3 times, and its valeurs are as the basal body temperature.Then given the tested drug or saline, 30 min after 16 mg / Kg of body weight at the dose of apomorphine injection, to apomorphine 30 min after the temperature again measured, compared with the control group and saline control group of rectal temperature difference in the ambient temperature should be maintained at about 20 degrees.
- Applicationsn/a
- Downloadn/a
- UOM Each case
- FOB
US$
For more details, please contact local distributors!
Model Evaluation
Pathological Results
Cytokines Level
Statistical Analysis
SPSS software is used for statistical analysis, measurement data to mean ± standard deviation (x ±s), using t test and single factor analysis of variance for group comparison, P<0.05 indicates there was a significant difference, P<0.01 indicates there are very significant differences.
GIVEAWAYS
INCREMENT SERVICES
-
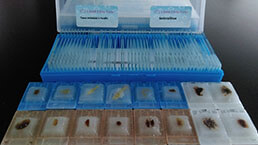 Tissue/Sections Customized Service
-
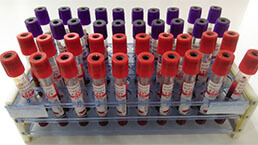 Serums Customized Service
-
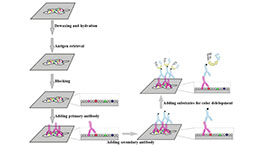 Immunohistochemistry (IHC) Experiment Service
-
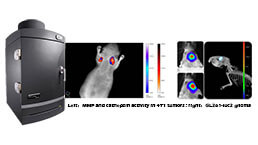 Small Animal In Vivo Imaging Experiment Service
-
 Small Animal Micro CT Imaging Experiment Service
-
 Small Animal MRI Imaging Experiment Service
-
 Small Animal Ultrasound Imaging Experiment Service
-
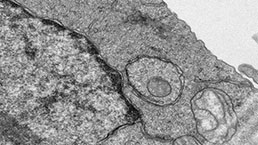 Transmission Electron Microscopy (TEM) Experiment Service
-
 Scanning Electron Microscope (SEM) Experiment Service
-
 Learning and Memory Behavioral Experiment Service
-
 Anxiety and Depression Behavioral Experiment Service
-
 Drug Addiction Behavioral Experiment Service
-
 Pain Behavioral Experiment Service
-
 Neuropsychiatric Disorder Behavioral Experiment Service
-
 Fatigue Behavioral Experiment Service
-
 Nitric Oxide Assay Kit (A012)
-
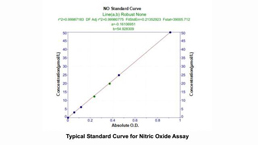 Nitric Oxide Assay Kit (A013-2)
-
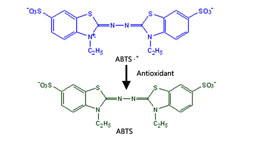 Total Anti-Oxidative Capability Assay Kit(A015-2)
-
 Total Anti-Oxidative Capability Assay Kit (A015-1)
-
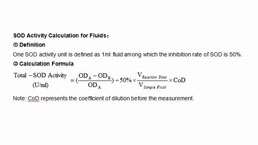 Superoxide Dismutase Assay Kit
-
 Fructose Assay Kit (A085)
-
 Citric Acid Assay Kit (A128 )
-
 Catalase Assay Kit
-
 Malondialdehyde Assay Kit
-
 Glutathione S-Transferase Assay Kit
-
 Microscale Reduced Glutathione assay kit
-
 Glutathione Reductase Activity Coefficient Assay Kit
-
 Angiotensin Converting Enzyme Kit
-
 Glutathione Peroxidase (GSH-PX) Assay Kit
-
 Cloud-Clone Multiplex assay kits
| Catalog No. | Related products for research use of Mus musculus (Mouse) Organism species | Applications (RESEARCH USE ONLY!) |
| DSI704Mu01 | Mouse Model for Chronic Stress Depression (CSD) | n/a |