
Packages (Simulation)
Quality Guarantee

Certificate
Rat Model for Rickets
- Product No.DSI805Ra01
- Organism SpeciesRattus norvegicus (Rat) Same name, Different species.
- Prototype SpeciesHuman
- SourceInduced by Vitamin D deficient diet and avoid light feeding
- Model Animal StrainsSD young rats (SPF), 21 days age, half male and half female
- Modeling GroupingRandomly divided into six group: Control group, Model group, Positive drug group and Test drug group
- Modeling Period6~8 weeks
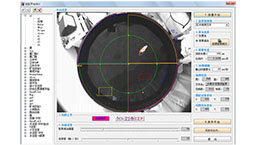
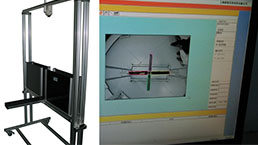
- Modeling Method1. Rickets group was fed with vitamin D and pure water, while the control group was fed with basic feed and tap water. Rats were fed for 6 weeks, and the bone mineral density (BMD) was measured by absortionmetry and DEXA (dual-energy X-ray).
2. Feed formula (%): corn flour 30g, bran 35g, fish 8g, soybean 20g, yeast 5g, 1g powder, salt 0.5g, methionine 0.1g, VitD 3 0.1g, a variety of vitamin 0.2g; the content of calcium was 1.18%. High calcium feed formula: on the basis of basic feed, coupled with calcium lactate and the right amount of bone meal to make up 1.8% of the total calcium. Lack of VitD feed formula (%): corn flour 76g, egg white powder 5g, wheat gluten 13g, calcium carbonate 5g, sodium chloride 1g (the formula by the Yunnan provincial science and Technology Commission does not contain VitD).
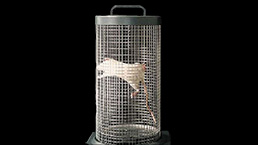
3. Animals were placed in a light room, and the rats were fed in a cage. Weight and body length were measured once a week. - ApplicationsDisease Model
- Downloadn/a
- UOM Each case
- FOB
US$ 280
For more details, please contact local distributors!
Model Evaluation
Results:
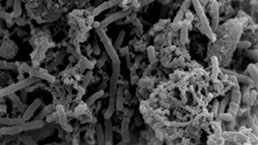
1. The epiphyseal end of the rats in the rickets group was enlarged, and the appearance of the brush and cup mouth changed.
2. The length and weight of rickets rats were significantly different from those of the control group. The lumbar spine BMD of rickets rats was lower than that of normal control group.
3. Lumbar spine bone mineral density of rickets rats compared with the normal control group, the BMD of lumbar spine was significantly lower than that of normal control group in BMD.
Pathological Results
Cytokines Level
Statistical Analysis
SPSS software is used for statistical analysis, measurement data to mean ± standard deviation (x ±s), using t test and single factor analysis of variance for group comparison, P<0.05 indicates there was a significant difference, P<0.01 indicates there are very significant differences.
GIVEAWAYS
INCREMENT SERVICES
-
 Tissue/Sections Customized Service
-
 Serums Customized Service
-
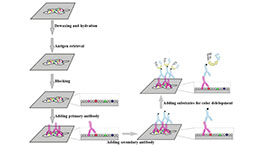 Immunohistochemistry (IHC) Experiment Service
-
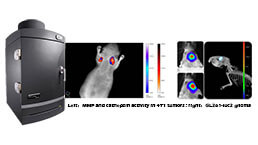 Small Animal In Vivo Imaging Experiment Service
-
 Small Animal Micro CT Imaging Experiment Service
-
 Small Animal MRI Imaging Experiment Service
-
 Small Animal Ultrasound Imaging Experiment Service
-
 Transmission Electron Microscopy (TEM) Experiment Service
-
 Scanning Electron Microscope (SEM) Experiment Service
-
 Learning and Memory Behavioral Experiment Service
-
 Anxiety and Depression Behavioral Experiment Service
-
 Drug Addiction Behavioral Experiment Service
-
 Pain Behavioral Experiment Service
-
 Neuropsychiatric Disorder Behavioral Experiment Service
-
 Fatigue Behavioral Experiment Service
-
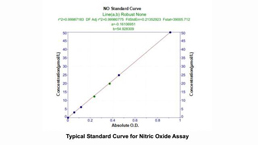
 Nitric Oxide Assay Kit (A012)
-
 Nitric Oxide Assay Kit (A013-2)
-
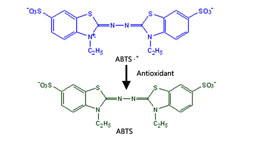 Total Anti-Oxidative Capability Assay Kit(A015-2)
-
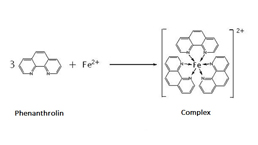 Total Anti-Oxidative Capability Assay Kit (A015-1)
-
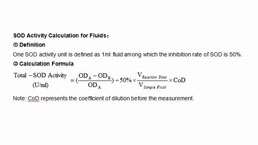 Superoxide Dismutase Assay Kit
-
 Fructose Assay Kit (A085)
-
 Citric Acid Assay Kit (A128 )
-
 Catalase Assay Kit
-
 Malondialdehyde Assay Kit
-
 Glutathione S-Transferase Assay Kit
-
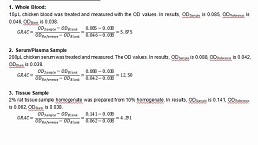
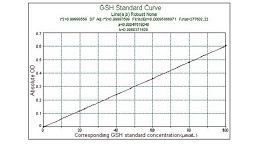
 Microscale Reduced Glutathione assay kit
-
 Glutathione Reductase Activity Coefficient Assay Kit
-
 Angiotensin Converting Enzyme Kit
-
 Glutathione Peroxidase (GSH-PX) Assay Kit
-
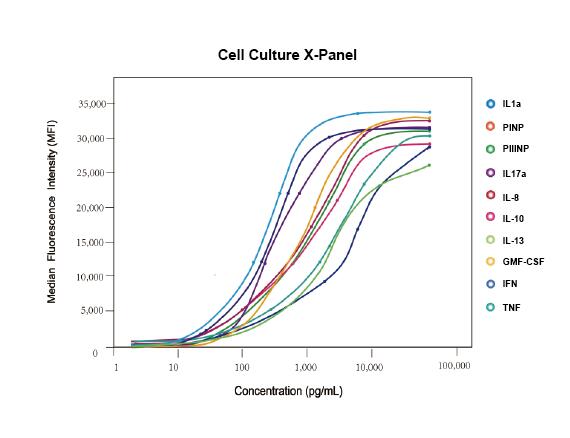 Cloud-Clone Multiplex assay kits
| Catalog No. | Related products for research use of Rattus norvegicus (Rat) Organism species | Applications (RESEARCH USE ONLY!) |
| DSI805Ra01 | Rat Model for Rickets | Disease Model |