
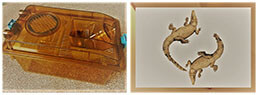
Packages (Simulation)
Quality Guarantee

Certificate
Mouse Model for Aplastic Anemia (AA)
- Product No.DSI675Mu01
- Organism SpeciesMus musculus (Mouse) Same name, Different species.
- Prototype SpeciesHuman
- SourceInduced by ( 60) Co Irradiation
- Model Animal StrainsBalb/c Mice(SPF), healthy, male, age: 4~6weeks, body weight:18g~20g
- Modeling GroupingRandomly divided into six group: Control group, Model group, Positive drug group and Test drug group.
- Modeling Period4-6 weeks
- Modeling Methodn/a
- Applicationsn/a
- Downloadn/a
- UOM Each case
- FOB
US$ 200
For more details, please contact local distributors!
Model Evaluation
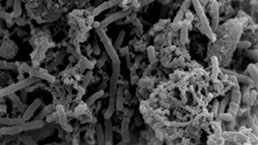
Pathological Results
Cytokines Level
Statistical Analysis
SPSS software is used for statistical analysis, measurement data to mean ± standard deviation (x ±s), using t test and single factor analysis of variance for group comparison, P<0.05 indicates there was a significant difference, P<0.01 indicates there are very significant differences.
GIVEAWAYS
INCREMENT SERVICES
-
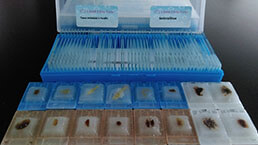 Tissue/Sections Customized Service
-
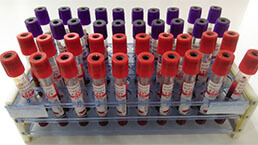 Serums Customized Service
-
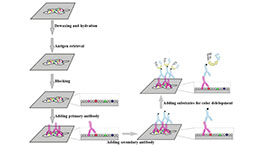 Immunohistochemistry (IHC) Experiment Service
-
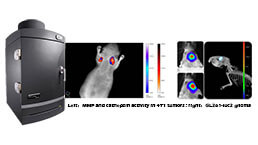 Small Animal In Vivo Imaging Experiment Service
-
 Small Animal Micro CT Imaging Experiment Service
-
 Small Animal MRI Imaging Experiment Service
-
 Small Animal Ultrasound Imaging Experiment Service
-
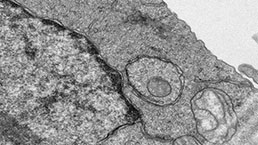 Transmission Electron Microscopy (TEM) Experiment Service
-
 Scanning Electron Microscope (SEM) Experiment Service
-
 Learning and Memory Behavioral Experiment Service
-
 Anxiety and Depression Behavioral Experiment Service
-
 Drug Addiction Behavioral Experiment Service
-
 Pain Behavioral Experiment Service
-
 Neuropsychiatric Disorder Behavioral Experiment Service
-
 Fatigue Behavioral Experiment Service
-
 Nitric Oxide Assay Kit (A012)
-
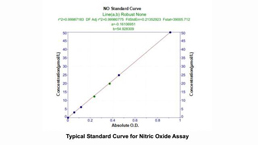 Nitric Oxide Assay Kit (A013-2)
-
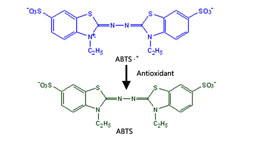 Total Anti-Oxidative Capability Assay Kit(A015-2)
-
 Total Anti-Oxidative Capability Assay Kit (A015-1)
-
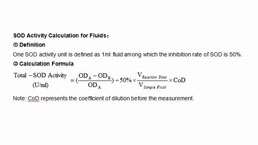 Superoxide Dismutase Assay Kit
-
 Fructose Assay Kit (A085)
-
 Citric Acid Assay Kit (A128 )
-
 Catalase Assay Kit
-
 Malondialdehyde Assay Kit
-
 Glutathione S-Transferase Assay Kit
-
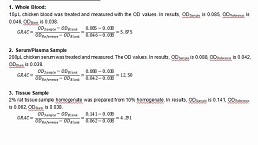
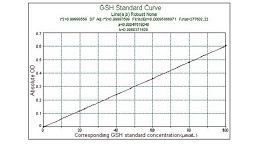
 Microscale Reduced Glutathione assay kit
-
 Glutathione Reductase Activity Coefficient Assay Kit
-
 Angiotensin Converting Enzyme Kit
-
 Glutathione Peroxidase (GSH-PX) Assay Kit
-
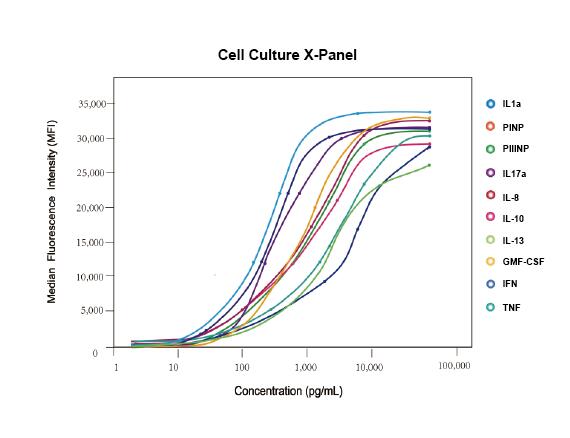 Cloud-Clone Multiplex assay kits
| Catalog No. | Related products for research use of Mus musculus (Mouse) Organism species | Applications (RESEARCH USE ONLY!) |
| DSI675Mu02 | Mouse Model for Aplastic Anemia (AA) | n/a |
| DSI675Mu03 | Mouse Model for Aplastic Anemia (AA) | n/a |
| DSI675Mu04 | Mouse Model for Aplastic Anemia (AA) | n/a |
| DSI675Mu01 | Mouse Model for Aplastic Anemia (AA) | n/a |