
Packages (Simulation)
Image (II)
-
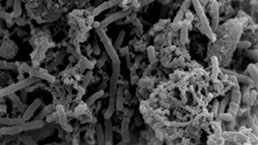
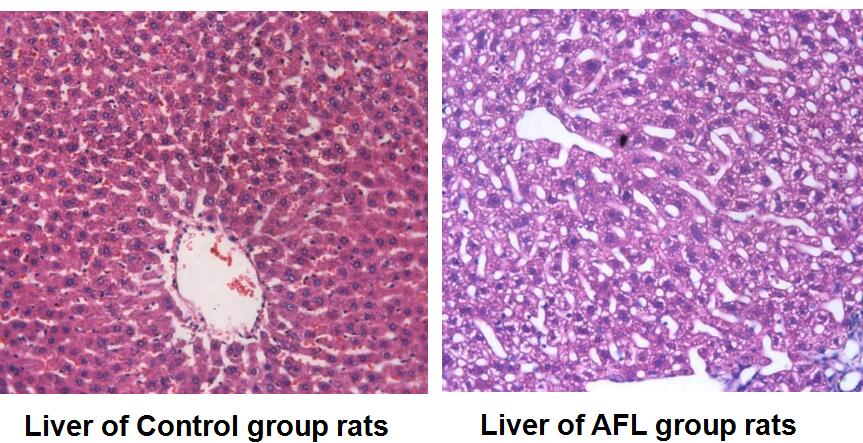 Fig 1. The liver histopathological changes of rats (HE staining x200)
Quality Guarantee

Certificate
Rat Model for Alcoholic Hepatitis (AH)
Alcoholic Liver Disease
- Product No.DSI531Ra01
- Organism SpeciesRattus norvegicus (Rat) Same name, Different species.
- Prototype SpeciesHuman
- SourceChronic alcoholic liver disease (ALD) induced by long term intake of alcohol
- Model Animal StrainsSD Rats (SPF), healthy, male, bodyweight:180g~200g
- Modeling GroupingRandomly divided into six group: Control group, Model group, Positive drug group and Test drug group (three doses).
- Modeling Period12 w
- Modeling Method1. Rats in normal group were free to drink water.
2. Rats in alcoholic fatty liver disease(AFL) group drink alcohol, the alcohol concentration from the beginning of 5%, each concentration was maintained for a week, in order to 10%, 15%, 20%, 25%, 30%, 35% to 40%, with 40% concentration lasted for 12 weeks.
3. On the course of the experiment, the rats in each group were given ordinary pellet feed for 12 weeks.
4. At the end of the 12th week, the animals were fasted for 12 hours, weighed, and take the blood from the inferior vena cava. - ApplicationsUsed to study the pathogenesis of alcoholic liver disease and to screen the drugs for prevention and treatment of alcoholic liver disease
- Downloadn/a
- UOM Each case
- FOB
US$ 240
For more details, please contact local distributors!
Model Evaluation
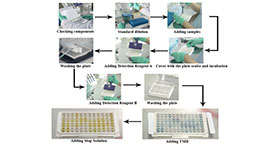
1. Detection of blood biochemical parameters
The contents of ALT, AST, TC, TG, FFA, LDL-C, HDL-C and blood glucose.
Pathological Results
2. Histopathological changes of liver
The results showed that the volume of liver in rats with alcoholic fatty liver and sucrose was significantly increased
Swelling, membrane tension, the edge of the round blunt, milk yellow, greasy section, especially in the abdominal cavity after the accumulation of retroperitoneal fat
Obvious.
HE staining showed that there was no obvious fatty degeneration in the liver of the normal group, and the hepatic lobule structure was normal. In the AFL model group, the liver was filled with a lot of fat degeneration, and the volume of the cells increased.
Cytokines Level
The content of TNF-α and ApoB in serum were detected by ELISA method.
Statistical Analysis
SPSS software is used for statistical analysis, measurement data to mean ± standard deviation (x ±s), using t test and single factor analysis of variance for group comparison, P<0.05 indicates there was a significant difference, P<0.01 indicates there are very significant differences.
GIVEAWAYS
INCREMENT SERVICES
-
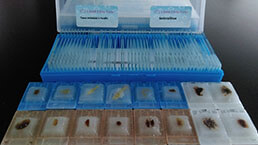 Tissue/Sections Customized Service
-
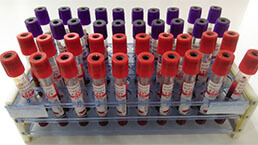 Serums Customized Service
-
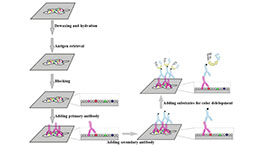 Immunohistochemistry (IHC) Experiment Service
-
 Small Animal Micro CT Imaging Experiment Service
-
 Small Animal MRI Imaging Experiment Service
-
 Small Animal Ultrasound Imaging Experiment Service
-
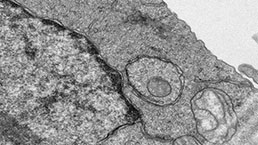 Transmission Electron Microscopy (TEM) Experiment Service
-
 Scanning Electron Microscope (SEM) Experiment Service
-
 Learning and Memory Behavioral Experiment Service
-
 Anxiety and Depression Behavioral Experiment Service
-
 Drug Addiction Behavioral Experiment Service
-
 Pain Behavioral Experiment Service
-
 Neuropsychiatric Disorder Behavioral Experiment Service
-
 Fatigue Behavioral Experiment Service
-
 Nitric Oxide Assay Kit (A012)
-
 Nitric Oxide Assay Kit (A013-2)
-
 Total Anti-Oxidative Capability Assay Kit(A015-2)
-
 Total Anti-Oxidative Capability Assay Kit (A015-1)
-
 Superoxide Dismutase Assay Kit
-
 Fructose Assay Kit (A085)
-
 Citric Acid Assay Kit (A128 )
-
 Catalase Assay Kit
-
 Malondialdehyde Assay Kit
-
 Glutathione S-Transferase Assay Kit
-
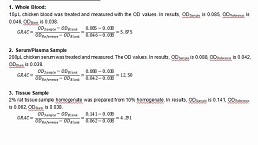
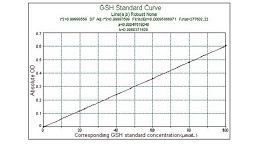
 Microscale Reduced Glutathione assay kit
-
 Glutathione Reductase Activity Coefficient Assay Kit
-
 Angiotensin Converting Enzyme Kit
-
 Glutathione Peroxidase (GSH-PX) Assay Kit
-
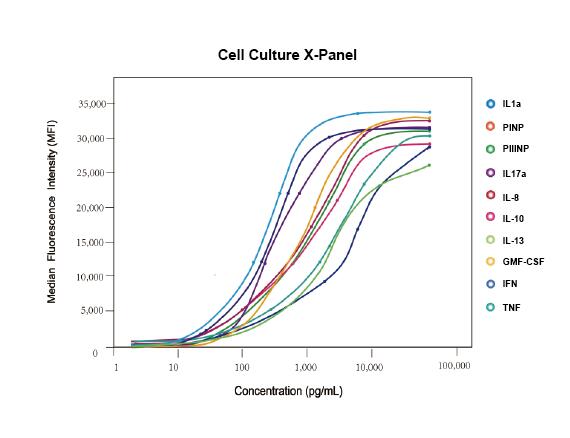 Cloud-Clone Multiplex assay kits
| Catalog No. | Related products for research use of Rattus norvegicus (Rat) Organism species | Applications (RESEARCH USE ONLY!) |
| DSI531Ra02 | Rat Model for Alcoholic Hepatitis (AH) | n/a |
| DSI531Ra01 | Rat Model for Alcoholic Hepatitis (AH) | Used to study the pathogenesis of alcoholic liver disease and to screen the drugs for prevention and treatment of alcoholic liver disease |